Thursday, August 28, 2014

Box and Whisker Plots

Watch this video as many times as you need.  Complete all questions throughout the video.  Don't forget to WSQ in your notebooks.  Problems taken from Holt Mathematics Course 2 online textbook materials. 

W = Work out any problems you are given in the video in your notes.
S = Summarize the video.  This can be done using bullets.  Answer the summary questions below.
Q = Question you have or a question someone else might have about the information in the video.

Summary:

  1. How do you create a box and whisker plot? (List the steps.)  
  2. What are quartiles?
  3. How do you find quartiles?
  4. What percent of the data falls into each quartile?
  5. Draw and label an example of a Box-and-Whisker Plot.

Or Watch the Longer Version Below


Sunday, August 24, 2014

Histograms

Watch the video as many times as you need.  Complete the problems throughout the video in your notebookCalculators MAY NOT be used. 

Also include on the page your WSQ.  (Show Work, Summary of the lesson, Question you have about the lesson. If you have no questions, write a question you think another person watching this video might have.)


Summary:

1.  How do you create a Histogram?  OR Describe the characteristics of a histogram.
2. Why are histograms useful?
3. How are Histograms and Bar Graphs different?
4. How are Histograms and Bar Graphs Similar?

Notebook Set-Up:


OR watch the following if you feel confident with bar graphs:


Problems taken from Holt Mathematics Course 2 online textbook materials.

Work to Video #1:

Tuesday, August 19, 2014

Using Frequency Displays

Watch the video as many times as you need.  Complete the problems throughout the video in your notebookCalculators MAY NOT be used. 

Also include on the page your WSQ.  (Show Work, Summary of the lesson, Question you have about the lesson. If you have no questions, write a question you think another person watching this video might have.)

Summary:
1. How do you find the mean, median, mode, and range on a dot plot?
2. How do you find the mean, median, mode, and range on a frequency table?
3. What are the most important things to remember when finding the MOCTs and Range on a frequency table and dot plot? (Helpful hints)


Solutions to Work:


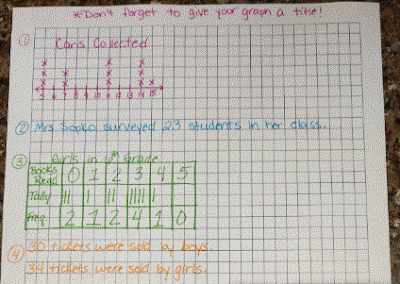
Frequency Displays (Practice Lesson)

Watch the video as many times as you need.  Complete the problems throughout the video in your notebookCalculators MAY NOT be used. 

Also include on the page your WSQ.  (Show Work, Summary of the lesson, Question you have about the lesson. If you have no questions, write a question you think another person watching this video might have.)

Summary:
1. How do you create a dot plot?
2. How do you create a frequency table?
3. Why are dot plots and frequency tables useful?


Work Solutions:


Monday, August 11, 2014